(IF YOU WOULD LIKE ME TO MAKE COPIES FOR YOU, PLEASE EITHER EMAIL THEM TO ME THE NIGHT BEFORE YOUR SPEECH or BRING THEM IN BEFORE SCHOOL ON THE DAY YOU SPEAK)
1. Go to GOOGLE (CLICK HERE FOR A QUICK LINK) or some other search engine with images;
2. In the search area: type in your subject (or a similar key word) "Your Subject AND CHART" (i.e. I typed in pollution and chart);
3. Locate a chart that related to your speech/topic--make sure that it fits nicely with your topic and your speech;
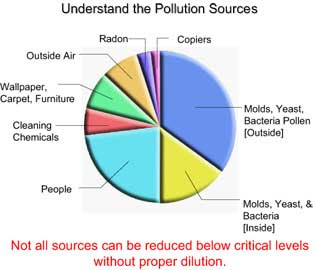
4. Here's what I found for pollution and chart CLICK THIS LINK TO SEE SPOT ON GOOGLE FEATURING THIS CHART

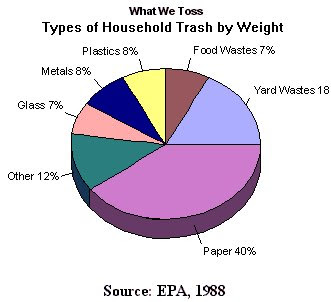
5. I also found this chart for air pollution CLICK THIS LINK TO SEE SPOT ON GOOGLE FEATURING THIS CHART

6. Save the chart(s) to your desktop (make sure that you copy down the information from where you retrieved the information--you need to give credit);
7. Open up a Word Document:
8. Insert the chart into the document OR BETTER YET Insert a text box into your document, then insert the picture into the text box. It can be resize inside of the text box.
9. The text boxes and charts can be re sized to meet your needs (if one chart by itself is too blurry, find several small ones to fit on the page of your handout);
10. Make sure that you create a heading (at the top) for your VA (visual aid) and that you give credit to the site/source (under each chart) from which you received the information.